
Page 226 - DJML Annual Report 24-25
P. 226
DJ MEDIAPRINT & LOGISTICS LIMITED
March 31, 2025
(All amount in Rupees lakhs, unless otherwise stated)
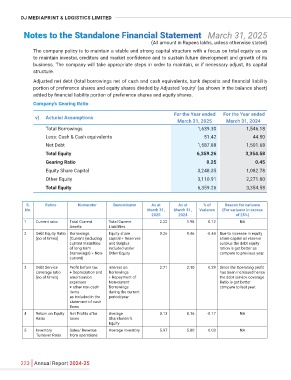
The company policy is to maintain a stable and strong capital structure with a focus on total equity so as
to maintain investor, creditors and market confidence and to sustain future development and growth of its
business. The company will take appropriate steps in order to maintain, or if necessary adjust, its capital
structure.
Adjusted ne deb (tota borrowing ne of ca and ca equivalents, ba depo and financia liab
portion of preference shares and equity shares divided by Adjusted ‘equity’ (as shown in the balance sheet)
added by financial liability portion of preference shares and equity shares.
For the Year ended For the Year ended
v) Acturial Assumptions
March 31, 2025 March 31, 2024
Total Borrowings 1,639.30 1,546.18
Less: Cash & Cash equivalents 51.42 44.50
Net Debt 1,587.88 1,501.68
Total Equity 6,359.26 3,354.58
Gearing Ratio 0.25 0.45
Equity Share Capital 3,248.35 1,082.78
Other Equity 3,110.91 2,271.80
Total Equity 6,359.26 3,354.58
S. Ratios Numerator Denominator As at As at % of Reason for variance
No. March 31, March 31, Variance (For variance in excess
2025 2024 of 25%)
1 Current ratio Total Current Total Current 2.22 1.98 0.12 NA
Assets Liabilities
2 Debt Equity Ratio Borrowings Equity share 0.26 0.46 -0.44 Due to increase in equity
(no of times) (Current (including capital + Reserves share capital an reserve
current maturities and Surplus surplus the debt equity
of long term included under ration is got better as
borrowings) + Non- Other Equity compare to previous year.
current)
3 Debt Service Profit before tax Interest on 2.71 2.10 0.29 Since the Operating profit
coverage ratio + Depreciation and Borrowings has been increased hence
(no of times) amortisation + Repayment of the debt service coverage
expenses Non-current Ratio is got better
+ other non cash Borrowings compare to last year.
items during the current
as included in the period/year
statement of cash
flows
4 Return on Equity Net Profits after Average 0.13 0.16 -0.17 NA
Ratio taxes Shareholder’s
Equity
5 Inventory Sales/ Revenue Average Inventory 5.97 5.80 0.03 NA
Turnover Ratio from operations
223 Annual Report 2024-25