
Page 164 - DJML Annual Report 24-25
P. 164
DJ MEDIAPRINT & LOGISTICS LIMITED
CORPORATE OVERVIEW STATUTORY REPORTS FINANCIAL STATEMENTS
DEPRECIATION & PROFIT AFTER
EMPLOYEE OPERATING AMORTIZATION 8.46%
EMOLUMENTS 4.44% PROFIT (PBDIT) TAX (PAT)
Depreciation charges increased to ₹660.27 lakhs in FY The company reported a profit after tax of ₹654.91 lakhs
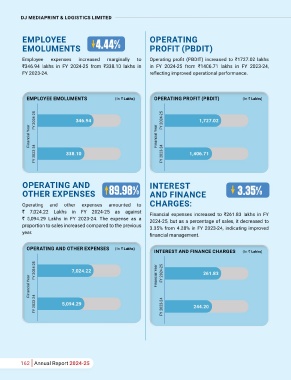
Employee expenses increased marginally to Operating profit (PBDIT) increased to ₹1727.02 lakhs 2024-25 from ₹531.78 lakhs in FY 2023-24. However, for FY 2024-25, representing a growth from ₹503.95
₹346.94 lakhs in FY 2024-25 from ₹338.10 lakhs in in FY 2024-25 from ₹1406.71 lakhs in FY 2023-24, the ratio to sales has decreased, reflecting efficient lakhs in the previous year.
FY 2023-24. reflecting improved operational performance. asset utilization.
PROFIT AFTER TAX (PAT) (In ` Lakhs)
DEPRECIATION & AMORTIZATION (In ` Lakhs)
EMPLOYEE EMOLUMENTS (In ` Lakhs) OPERATING PROFIT (PBDIT) (In ` Lakhs)
FY 2024-25 660.27 FY 2024-25 654.91
FY 2024-25 346.94 FY 2024-25 1,727.02 Financial Year Financial Year
Financial Year Financial Year FY 2023-24 531.78 FY 2023-24 503.95
FY 2023-24 338.10 FY 2023-24 1,406.71
OPERATING AND INTEREST 11
OTHER EXPENSES 89.98% AND FINANCE 3.35%
Operating and other expenses amounted to CHARGES: As at As at
` 7,024.22 Lakhs in FY 2024-25 as against Financial expenses increased to ₹261.83 lakhs in FY Ratio Basis March 31,2025 March 31, 2024
` 5,094.29 Lakhs in FY 2023-24. The expense as a 2024-25, but as a percentage of sales, it decreased to Current Ratio (In times) Current Assets / Current Liabilities 2.22 1.98
proportion to sales increased compared to the previous 3.35% from 4.28% in FY 2023-24, indicating improved
year. financial management. Debt Equity Ratio (In times Net Debt / Equity 0.26 0.46
Debt Service Coverage Ratio Earning for Debt Service/ Debt 2.71 2.10
OPERATING AND OTHER EXPENSES (In ` Lakhs) (in times) Services
INTEREST AND FINANCE CHARGES (In ` Lakhs)
Return On Equity Ratio (in %) Profit after Tax/ Shareholder's Equity 0.13 0.16
FY 2024-25 7,024.22 Financial Year FY 2024-25 261.83 Trade Receivables Turnover Revenue From Operations/Average 3.58 3.83
Trade Receivables
Ratio (in times
Financial Year Trade Payables Turnover Cost of Operations/ Average Trade 3.95 4.39
Payables
Ratio (in times)
3.07
Net Capital Turnover Ratio
Revenue From Operations/Working
2.71
FY 2023-24 5,094.29 FY 2023-24 244.20 (in times) Capital 0.08 0.09
Net Profit Ratio (in %)
Net Profit/(Loss) after Tax /Revenue
Return on Capital Employed From operation 0.13 0.18
Earnings Before Interest and Tax /
(in %) capital Employed
162 Annual Report 2024-25 Annual Report 2024-25 163